Some of my data visualisations and the packages I used to make them
Shiny (R). Crimes for days of the week at 3 locations/times. This is interactive (click on image) though it is hosted on a slow website.
|
R. Presentation of my data story to the Women in Big Data Canberra group, March 28th 2019.
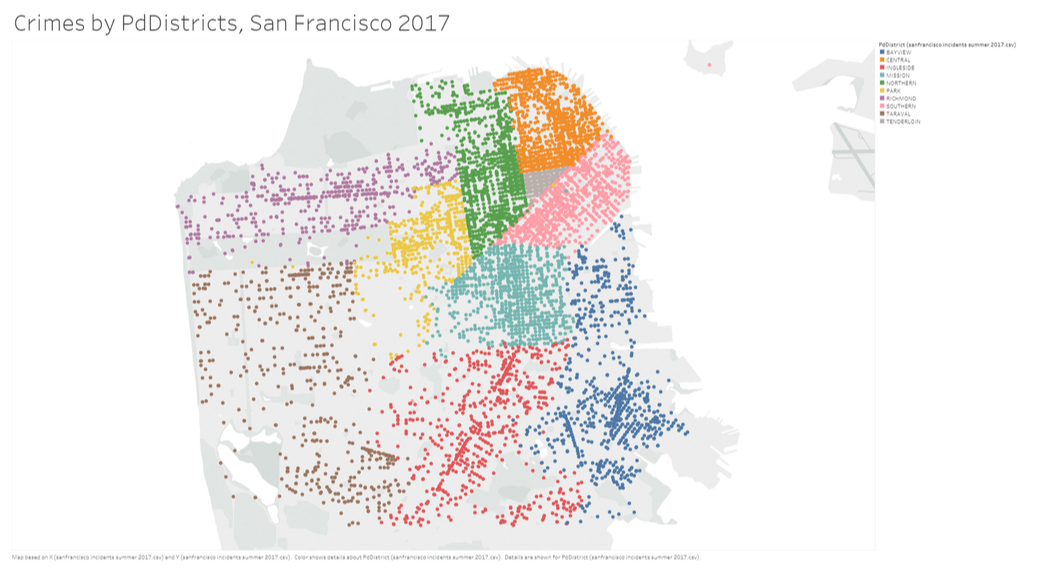
Tableau map. Locations of crimes.

R bubbleplot.
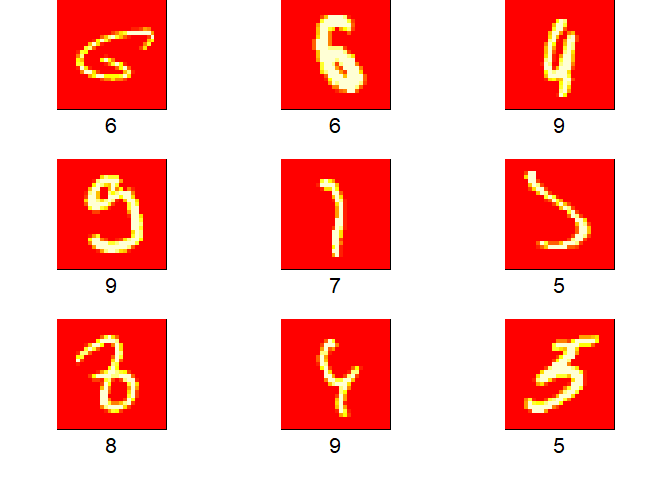 R. Playing with AI character recognition with keras. These are some of the most difficult digits to recognise. R. Playing with AI character recognition with keras. These are some of the most difficult digits to recognise.
library(keras)
mnist<-dataset_mnist() x_test<-mnist$test$x y_test<-mnist$test$y rm(mnist) #sort(table(c(wrong_adam_20,wrong_rmsprop_20))) par(pty="s") par(mfrow=c(3,3)) par(mar=c(4,1,0,1)) for (i in c(1015, 1183, 1233, 1248, 1261, 1394, 1879, 1902, 2036) ){ image(t(x_test[i,,])[,28:1], xaxt="n", yaxt="n") title(xlab=y_test[i], line=1, cex.lab=2) } |
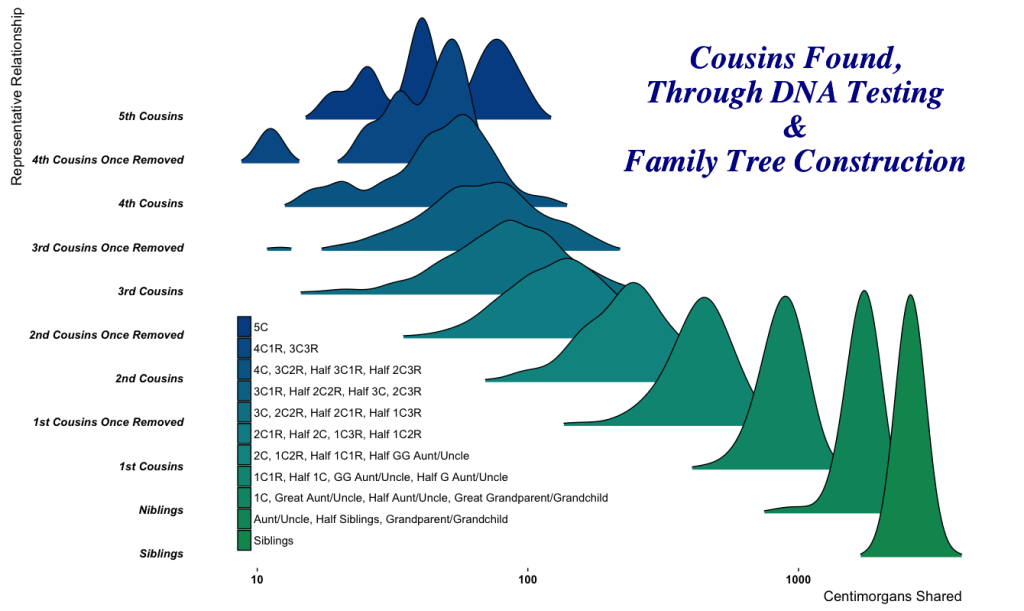
R ggplot2 joyplot. Same data as the exploded stacked barchart.
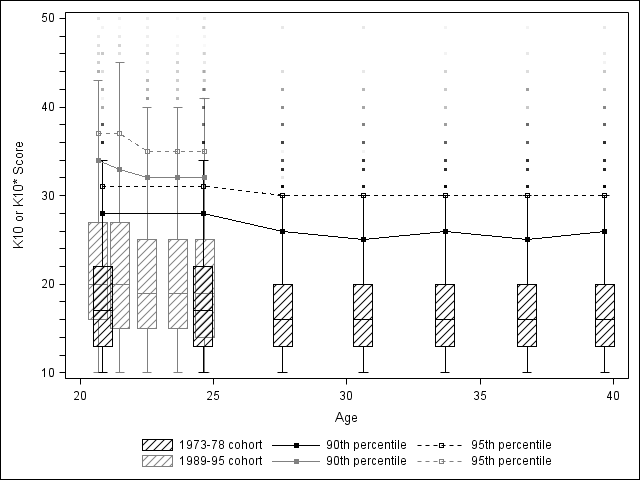
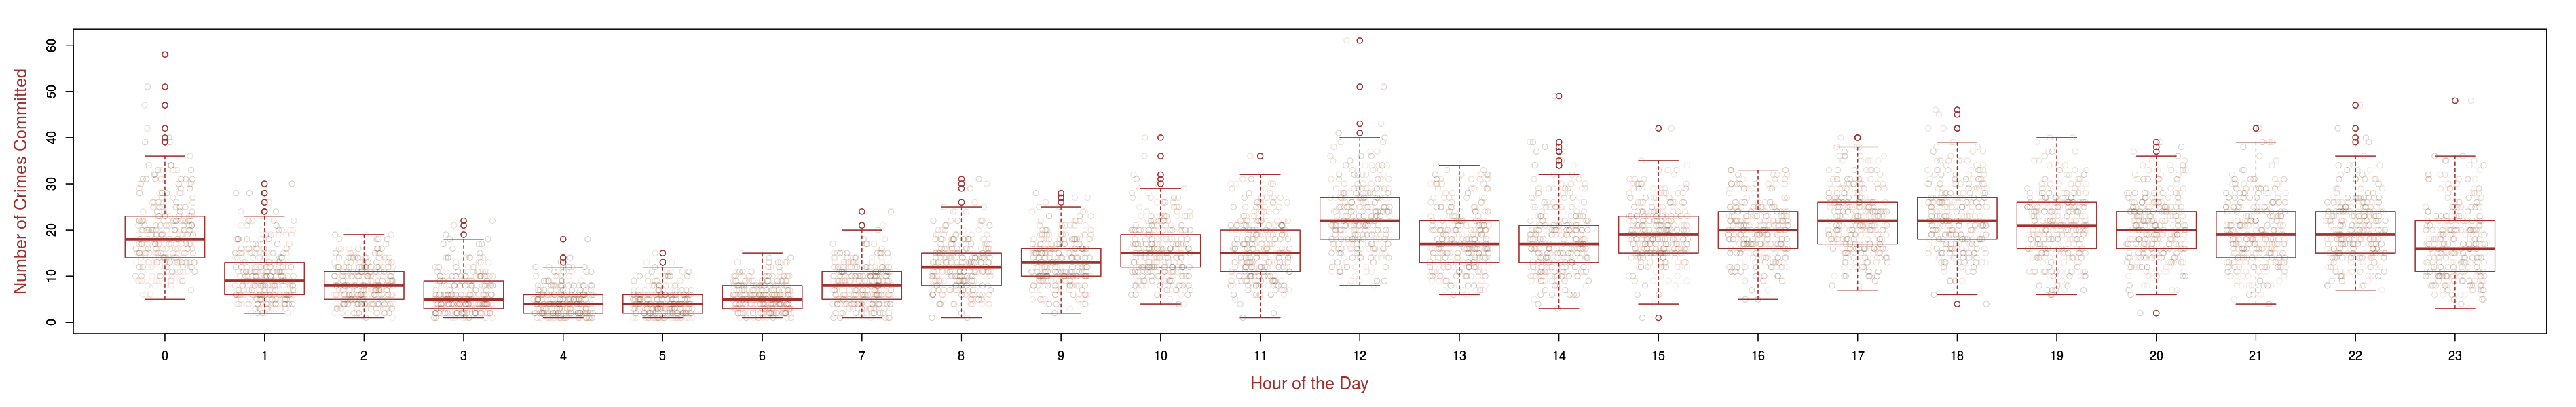
SAS boxplots. Made with proc template; define statgraph and proc sgrender.
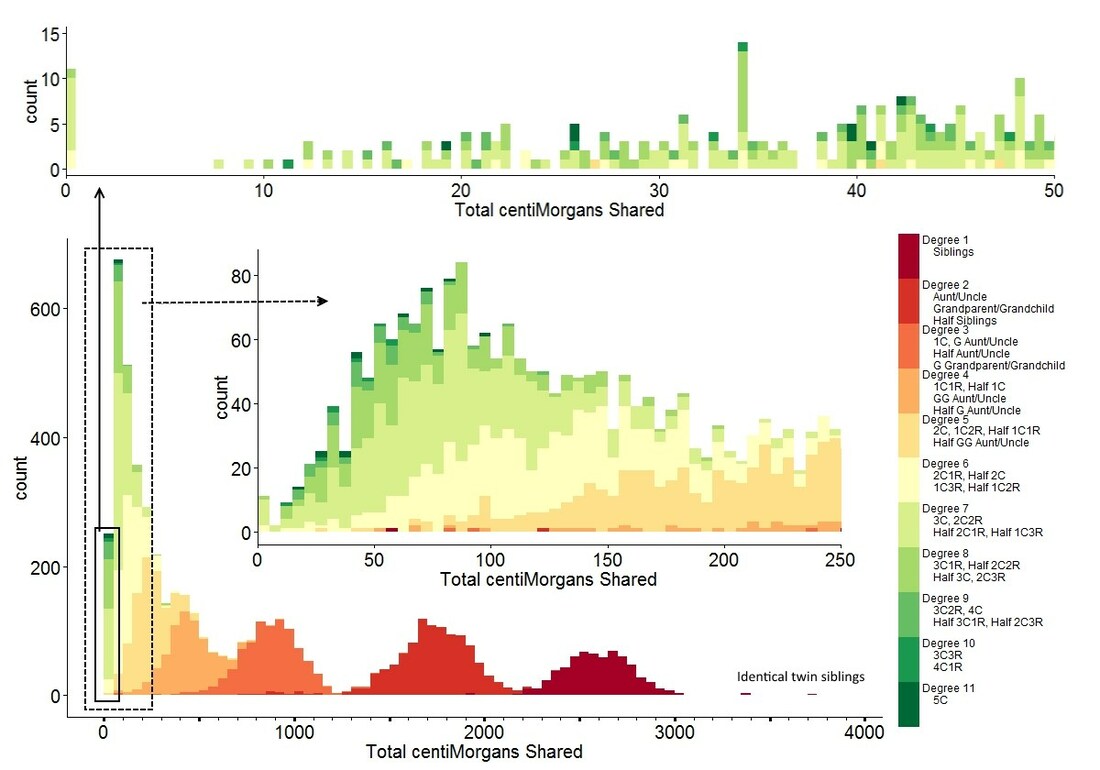
Base R graphics exploded stacked barchart. 600 people reported how many centimorgans of dna they shared with a known relative. This will help others work out their relationship with their dna matches.
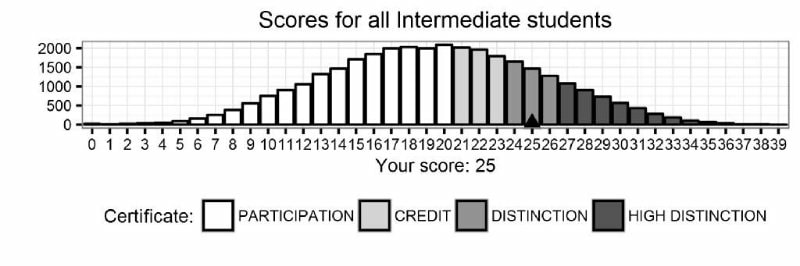
R and Excel. Prototype of visualisation for students' information regarding their result in a geography competition
|
